Overview
scrilla is a financial analysis application. It can calculate asset correlations, generate statistical summaries and produce various graphical visualizations to help with analysis. It was originally designed to optimize portfolio allocations using data it retrieves from external services (currently: AlphaVantage, IEX and Quandl), but has since taken on a life of its own as a way for me to explore the intersection of Python, application development, finance, statistics and mathematics.
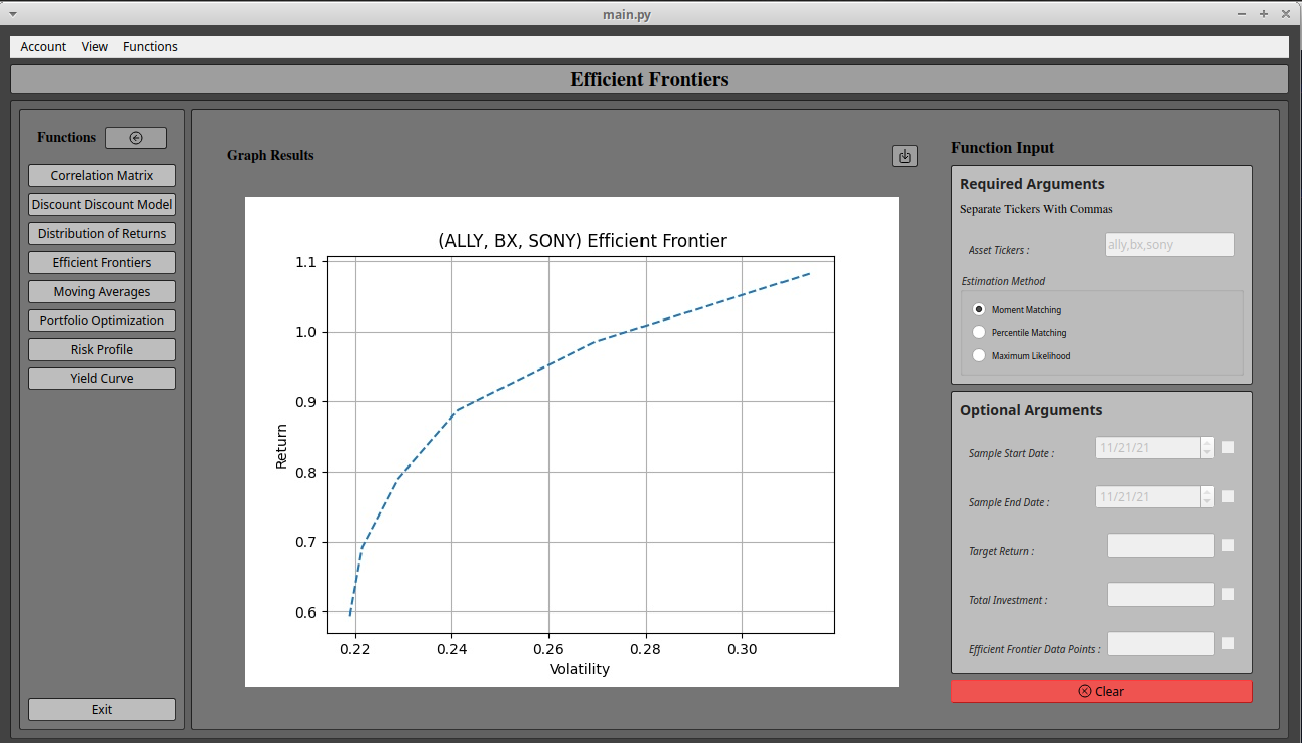
Statistical calculations are informed using the results of Ito Calculus. In other words, the sampling distributions for returns on assets are modeled through stochastic differential equations. The parameters of these models are estimated with statistical techniques. scrilla can estimate financial statistics in a variety of ways; it can be configured to estimate using the method of moment matching, method of percentile matching(section 4.1.3.2) or maximum likelihood estimation. The estimation method can be configured by an environment variable to set a default for calculations, or explicitly passed into statistical functions. See Configuration and Usage for more information.
In terms of its original purpose, portfolios are optimized, using the procedures of Modern Portfolio Theory, by minimizing the portfolio’s variance/volatility, i.e. by finding the optimal spot on the portfolio’s efficient frontier as defined by the CAPM model. Alternatively, portfolios can be optimized by maximizing the portfolio’s Sharpe ratio or by minimizing the portfolio’s Conditional Value at Risk. See Usage for more information.
This application optimizes across asset classes; the theoretical portfolio being constructed can be composed of equities, cryptocurrencies or both. In a future release, I would like to include fixed income assets, volatility assets (VIX futures, options, etc.) and other derivatives, but for now, only those two asset types are supported. I am looking for a good API that provides historical data on the other types of financial instruments before I bring them into the optimization algorithm, so if you know of one, contact me.
The program’s functions are wrapped in PySide6 widgets to provide a graphical user interface (this feature is still in development and may explode). Visualizations are created through matplotlib.
Documentation
Test Coverage
Code Analysis
Badge |
|---|
|
|


CI/CD Pipelines
Branch |
Status |
|---|---|
pypi/micro-update |
|
pypi/micro-update |
|
develop/main |
|


